In 2022, Flexport raised $935M at a valuation of $8B from an all-star group of investors including Andreessen Horowitz (a16z), MSD Partners, DST Global, Founders Fund, Shopify Ventures, and SoftBank.
Our analysis suggests Flexport’s current valuation might actually be more than 80% lower than the $8B valuation it last raised at in 2022 — or $1.4B to $1.6B.
Why? It’s a combination of the company being priced for perfection and macro headwinds.
Let’s dig in.
Some important notes:
- There are a few key data points we’re going to use here to show our work, thinking and assumptions, which you’ll see below. Generally, we’ve tried to use the assumptions/metrics that are most favorable to Flexport.
- If you have better data or see an assumption that is not correct which would markedly change the analysis and implied valuation, please let us know. We will update and refine the analysis based on your inputs and credit you.
THE DATA/ASSUMPTIONS
Container pricing
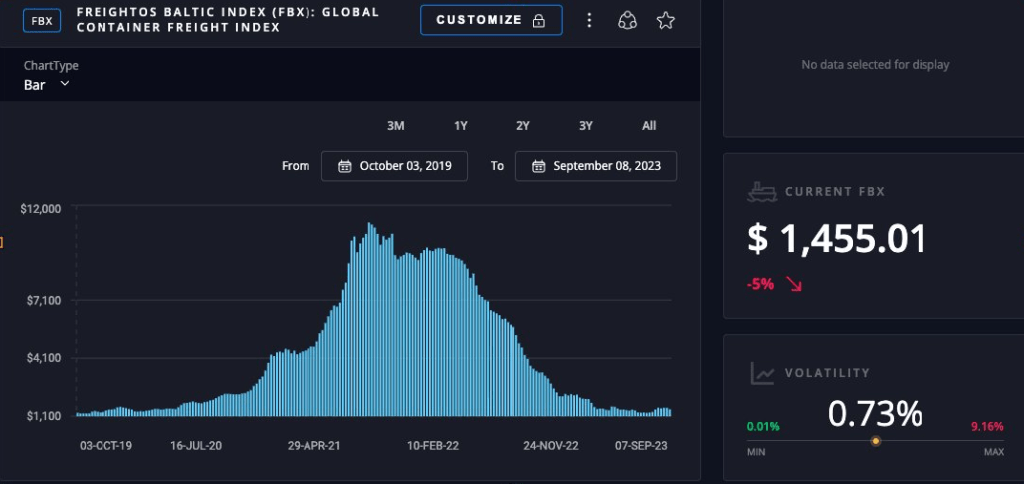
We’ve generally picked the price at the midpoint of each year with the exception of 2023, where we’ve used the current rate, according to the Freightos Baltic Index.
- 2023 – $1,455
- 2022 – $7,369
- 2021 – $10,500
- 2020 – $1,555
- 2019 – $1,200
Source: Freightos
Note that container pricing estimates vary by source (e.g., Platts and various equity research outfits have different numbers), but directionally the trend is consistent: container pricing has plummeted 85%+ since the peak as we’ve essentially reverted back to pre-pandemic levels.
Also, routes like China to North America East Coast are much more expensive (nearly double of the Index above at $3,048 per container per Freightos). As you’ll see, the underlying implication of this analysis doesn’t change as a result as long as the container price being used over time is consistent.
Flexport total revenue
- 2022 – $5B
- 2021 – $3.3B
- 2020 – $1.3B
- 2019 – $670M
- 2018 – $441M
- 2017 – $225M
Flexport net revenue
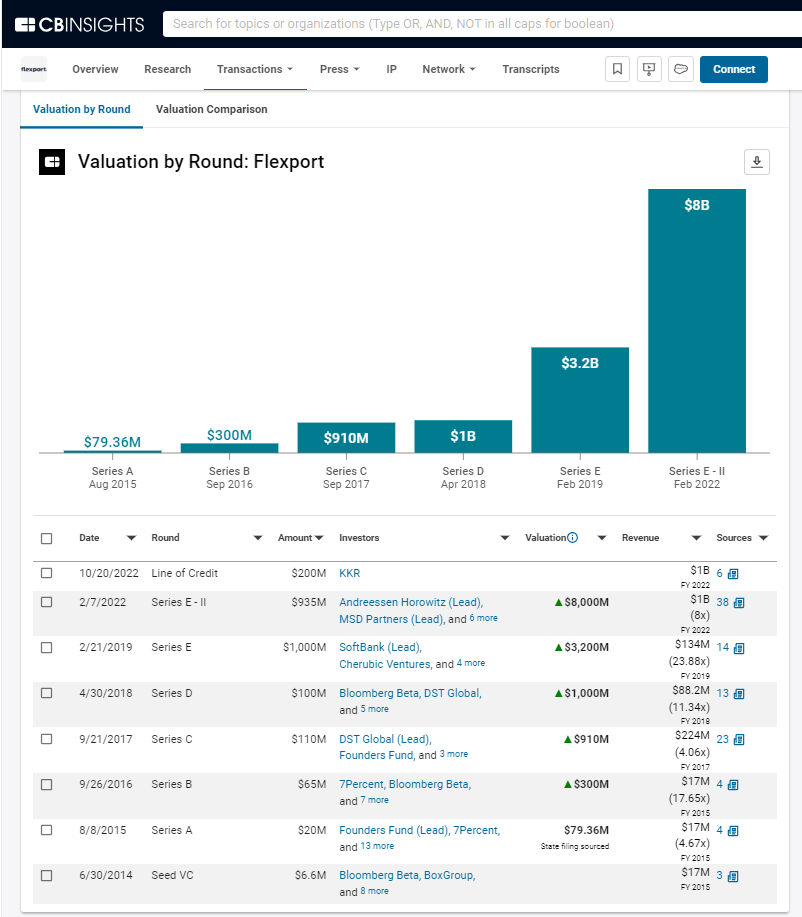
(Source: CB Insights — reflected in graphic below)
- 2022 – $1B
- 2021 – $660M
- 2020 – $260M
- 2019 – $134M
- 2018 – $88M
- 2017 – $45M
Please note that various reports have Flexport’s net revenue being 15-20% of total revenue.
Competitor Expeditors International‘s net revenue is at 13-14% of total revenue, but for this analysis we’re using the 20% reported figure per our earlier comment that the metric most favorable to Flexport will be used when making assumptions.
Flexport valuation
(Source: CB Insights — reflected in graphic below)
- 2022 – $8B
- 2019 – $3.2B
- 2018 – $1B
- 2017 – $910M
- 2016 – $300M
- 2015 – $79M
THE ANALYSIS
The key driver of valuation here is the number of containers Flexport handles on behalf of customers.
Flexport of course has other offerings like Flexport Capital, air, trucking, customs brokerage, cargo insurance, etc., but container shipping is the majority of its business based on media reports.
Notably KKR’s recent financing in October 2022 was for Flexport Capital, the company’s trade financing arm.
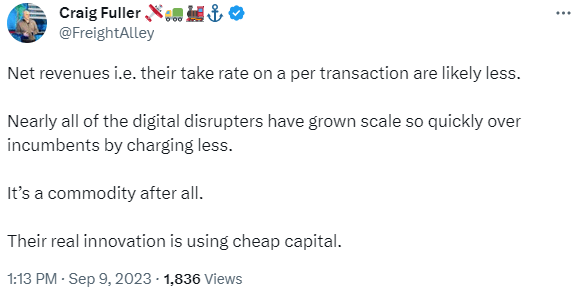
The 20% net revenue assumption detailed above aims to give Flexport credit for these other business/revenue lines. Per a Twitter comment by Craig Fuller, founder/CEO of FreightWaves, the assumed net revenue assumption of 20% is likely high, but again, we’ve erred on the side of taking the higher end of the estimates.
Source: Twitter
Now if we take total revenue above and divide by revenue/container from above, we get a view on total containers moved by Flexport.
Here’s where we land on the number of containers shipped in 2021 and 2022:
- 2022 – 678k (total revenue/Baltic Index pricing)
- 2021 – 314k
That suggests remarkable growth of 115% in containers handled over those 2 years based on the revenue numbers Flexport has shared with the media.
With that, we have enough to start thinking about a valuation for Flexport today.
Generally, container shipping volumes are down as Reuters reported in June 2023.
“Global trade remained in the doldrums during the second quarter as China’s post-lockdown rebound proved slower than expected and was offset by continued weakness in North America and Europe.
Volumes were down in three of the first four months of 2023 compared with a year earlier, according to the Netherlands Bureau of Economic Policy Analysis.”
Let’s give Flexport the benefit of being an insurgent here and assume that even though volumes are down globally, it’s able to take market share and as a result, it maintains the 678k containers it shipped last year.
We’ll then multiply that container volume by the current cost/container given above.
678,518 containers x $1,455 price/container
That yields revenue of $987M.
That would be 80% less than the $5B that was reported in 2022.
So what does this all mean for Flexport’s valuation?
Its 2022 financing round valued the company at $8B with total revenue of $5B — a 1.6x multiple.
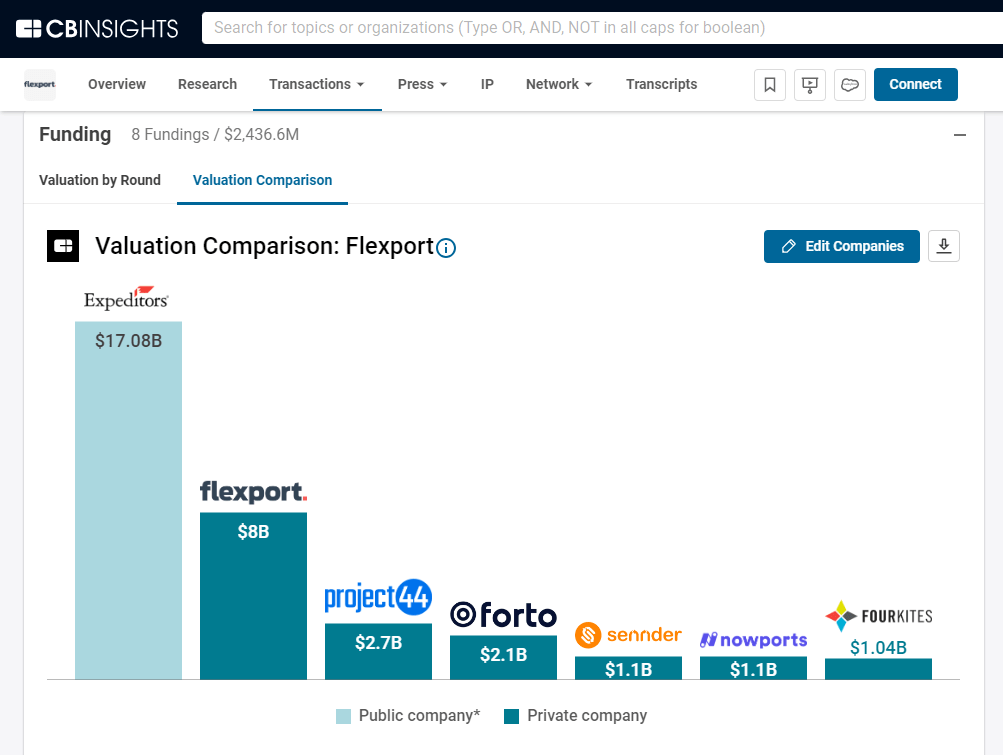
Competitor Expeditor has a price/revenue multiple of 1.43x and is valued at $17B as the Flexport comps below highlight.
Using these multiples, Flexport’s current indicative valuation would be $1.4B to $1.6B — an 80% haircut. This would be valuation levels last seen during its fundraising in 2018.
What could change this?
Most of the catalysts for a reversal of the revenue trend are a function of the macro environment — specifically container volumes going up and/or the price per container rebounding.
But right now, pressure on container pricing is expected to continue given sluggish demand and increased container capacity coming online. ING expects 9%, 11%, and 7% in capacity growth in 2023, 2024 and 2025, respectively.
Of course, Flexport could grow into its $8B valuation by capturing a greater share of the global container market. Bloomberg estimates say there are 226M containers shipped per year. Flexport at 678k containers today would represent 0.3% of the total container market.
To get back to $5B of revenue (its 2022 figure) and assuming container rates stay depressed, Flexport would need to grow container volume to 3.4M (5.1x growth over current levels).
That’s a gargantuan hill to climb.
Given this challenging backdrop, the move to a more disciplined cost structure is critical and a clear focus with the return of founder Ryan Petersen to the CEO spot after the resignation/dismissal of former CEO and Amazon veteran Dave Clark.
Links to relevant sources are below. Special thanks to the following for their great data and writing on the freight market and Flexport:
- Freightos data
- John Kemp (Reuters)
- Alex Konrad (Forbes)
- Josh Constine (SignalFire formerly TechCrunch)
- Walter Chen (Sacra)
Links:
- CB Insights – Shopify strategy map
- CB Insights – Flexport profile
- CB Insights – Shopify/Flexport newsletter
Want to see more research? Join a demo of the CB Insights platform.
If you’re already a customer, log in here.


